The UK has passed 3,000 courts.
Bubble?
Not even close, but some towns are already full
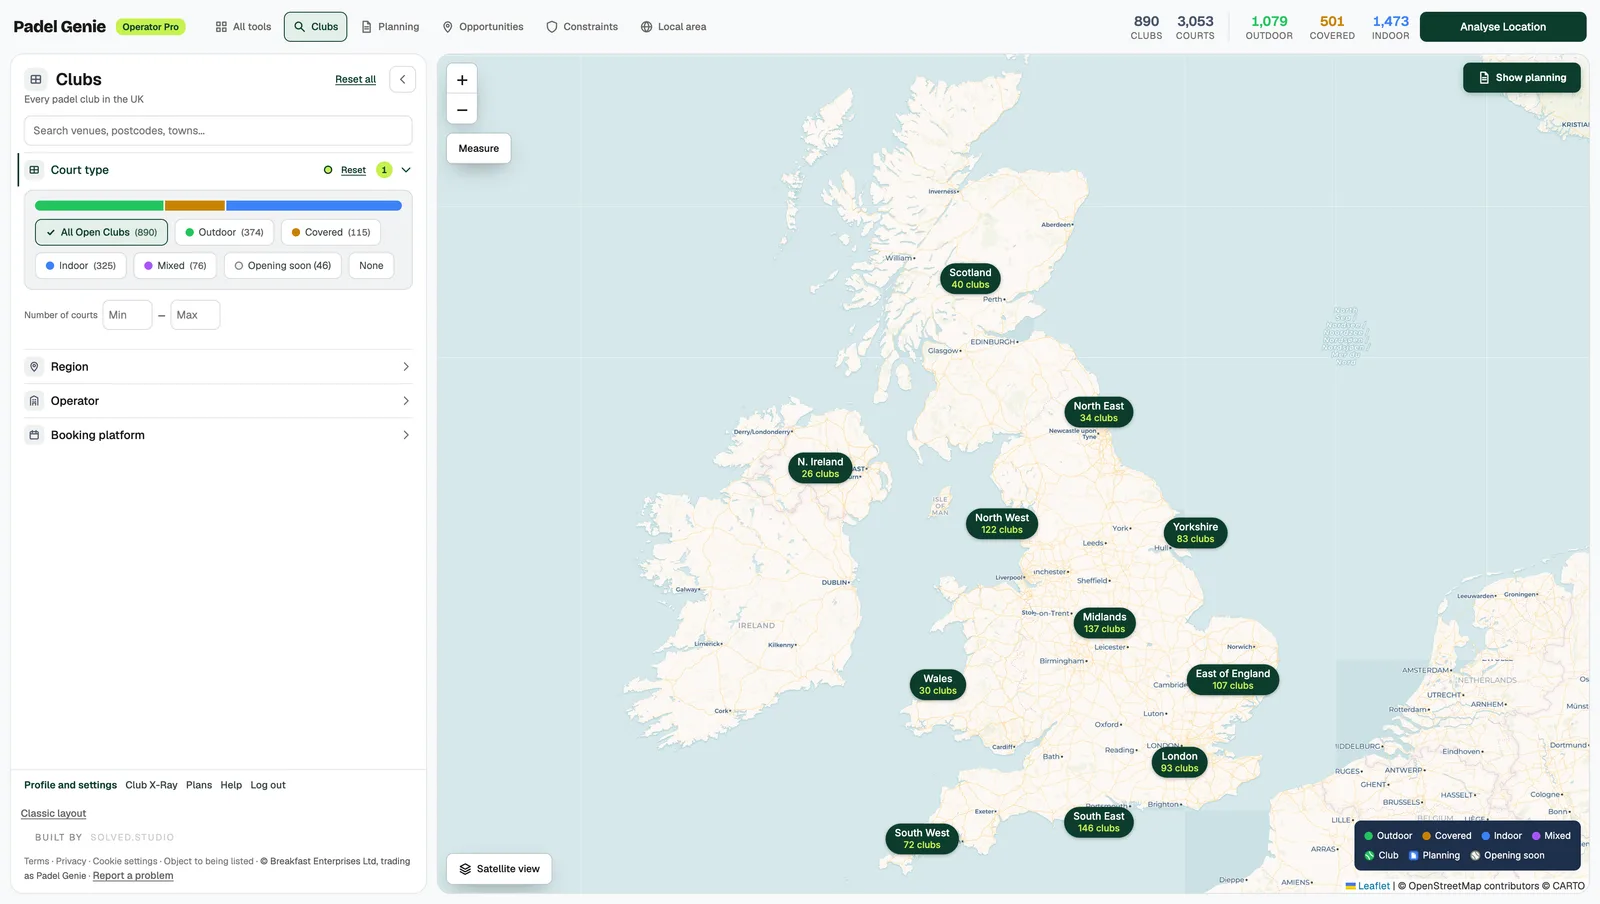
The UK now has 3,053 padel courts open across 890 clubs. That is the count on Padel Genie's live map as of 24 October 2026, covering England, Scotland, Wales and Northern Ireland.
It's a huge milestone for the sport. Especially since most people in Britain had never heard of 'Padel' a few years ago. But a national total only tells you part of the story, and certainly doesn't answer the question of whether there's a bubble (or not).
The real story is where the courts are, where they are not, and what is coming next. Here's what the data shows:
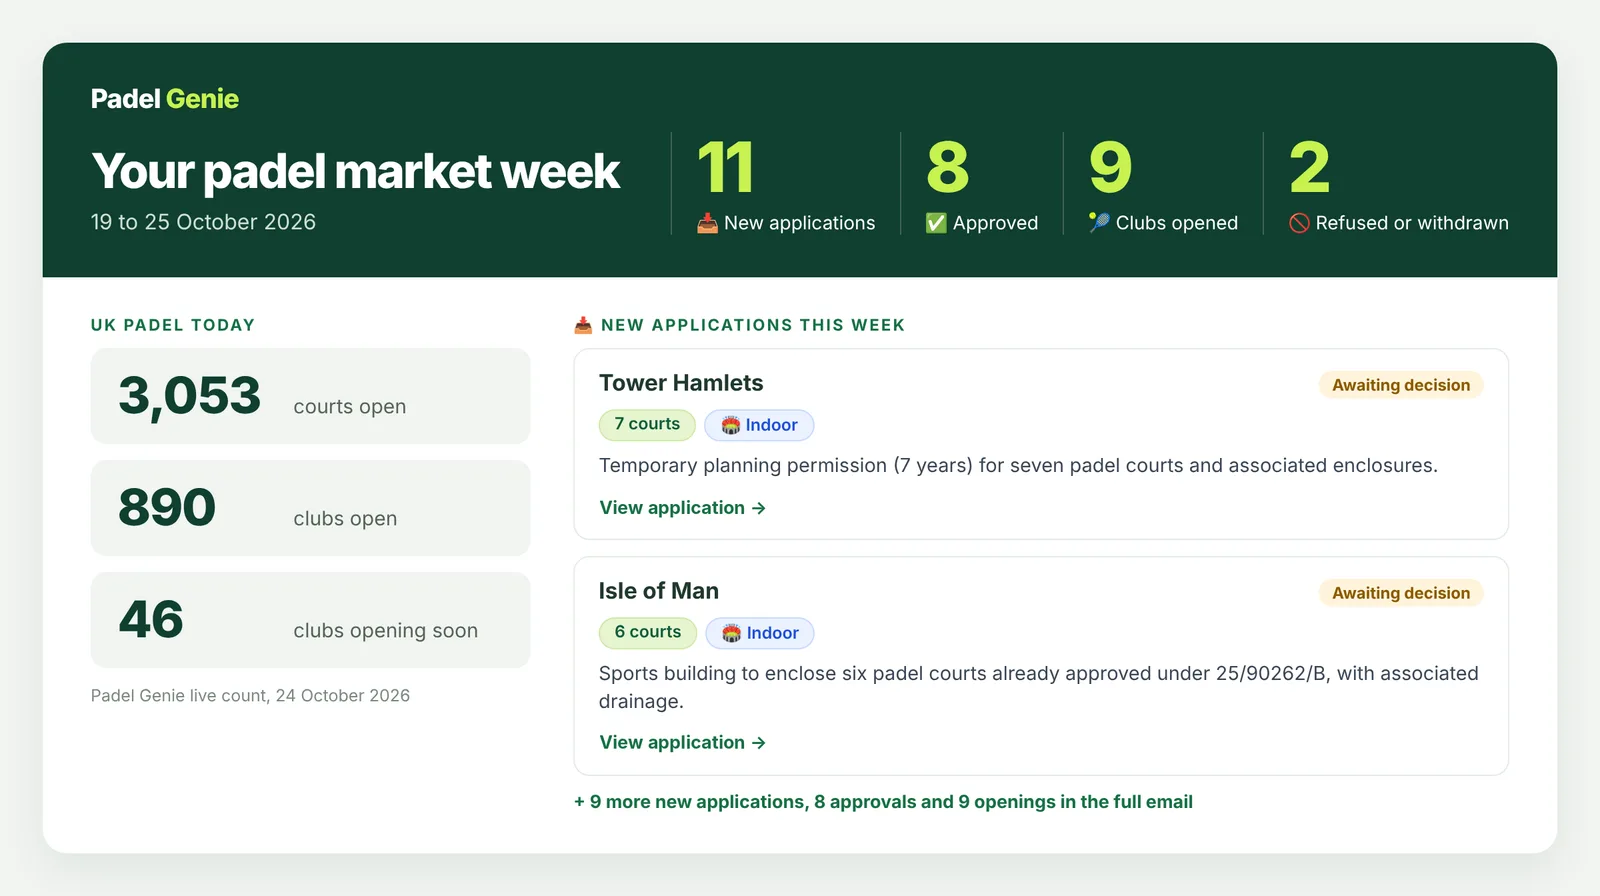
- The pipeline is deep. At least 1,276 courts were approved in the last 12 months, and at least 1,087 more are awaiting a decision.
- Councils are saying yes. They approved 85% of the new padel schemes they decided in the last year.
- The map is lopsided. Hertsmere has 26 courts per 100,000 people. 38 councils with more than 100,000 residents have none inside their boundary. If you're interested, Padel Genie can show you exactly where these are.
- London is underserved. At 3.8 courts per 100,000 people, it is the lowest of any English region.
- Northern Ireland is the surprise. At 6.5 courts per 100,000 people, it is level with the North West as the best-served part of the UK.
- Scotland and Wales lag behind. Scotland has 112 courts across 40 clubs, just 2.1 per 100,000 people and less than half the GB average. Wales has 110 courts across 30 clubs, about 3.5 per 100,000.
Today's numbers
England holds almost nine in ten UK courts, but every nation now has more than 100.
| Nation | Courts open | Clubs open | Courts per 100,000 people |
|---|---|---|---|
| England | 2,707 | 794 | 4.8 |
| Northern Ireland | 124 | 26 | 6.5 |
| Scotland | 112 | 40 | 2.1 |
| Wales | 110 | 30 | 3.5 |
| UK | 3,053 | 890 | 4.6 |
Clubs are still small. The average UK club has 3.4 courts, and the median is 3. The largest is Carbon Padel Club in Manchester with 17 courts. Rocket Padel Bristol and Padel Bonito in Sheffield follow with 14 each.
The UK is building indoors. Nearly half of UK courts (48%) are fully indoor, 16% are covered with open sides, and 35% are outdoor. Outdoor can still make good money, but the share of indoor and covered courts is rising fast.
The pipeline: what's coming next
Behind the 3,053 open courts, at least 2,363 more courts are either approved or awaiting a planning decision.
Well over 100 new padel applications, approvals and openings land across the UK every month, and any one of them can change a catchment's opportunity score overnight. Not every approval will get built. But even so, the direction is clear.
Our modelling shows there will be at least 4,000 courts open by this time next year. Supply isn't slowing down anytime soon.
| Stage | Schemes or clubs | Courts |
|---|---|---|
| Announced and coming soon | 46 clubs | 224 |
| Approved in the last 12 months | 572 new schemes | at least 1,276 |
| Awaiting a planning decision | 450 new schemes | at least 1,087 |
The road to 4,000
Approved and awaiting figures are floors.
Planning is not the bottleneck. Councils approved 85% of the new padel schemes they decided in the last 12 months: 572 approvals against 98 refusals. A further 66 were withdrawn. Count those as not approved and the rate is still 77.7%.
Decisions take about three and a half months. The median new scheme took 105 days from validation to decision. The middle half took between 64 and 165 days. Extensions of time are routinely agreed, so plan for it rather than fight it.
Where councils approved the most. East Riding of Yorkshire approved 12 new schemes in the last year and Sheffield 10. South Downs National Park, Sefton and Bromley approved 7 each. Sheffield stands out: it already has 51 open courts, the third most of any council.
Want the details? Padel Genie shows who's behind each application and what's planned: the number of courts, type of scheme (indoor, outdoor and covered) and additional facilities (pilates, yoga, F&B etc).
And you don't have to go looking. We email you the morning after an application lands in an area you track, with a weekly round-up of the whole market on top so you're already making decisions from the very latest data.
The lopsided map
Across Great Britain there are 4.5 courts for every 100,000 people, but that average hides huge swings from one town to the next. If there is one absolute truth about padel it is this:
Saturation is local, not national.
A national total tells you nothing about whether your town can take another club. The only question that matters is how saturated your catchment is.
By region. The North West leads Great Britain with 6.5 courts per 100,000 people. London has just 3.8, the lowest of any English region, despite the hype around padel in the capital. Scotland has 2.1, less than half the GB average.
Courts per 100,000 people, by region and nation
Padel Genie live count, 24 Oct 2026 · Census 2021 populations (ONS, NISRA) · Midlands combines East and West
North vs South. UK padel started in London and the South East, but per head the North West now leads every region in Great Britain. Four of the five councils with the most open courts are in the North: Cheshire East (57), North Yorkshire (52), Sheffield (51) and Leeds (45), with Birmingham (48) the other.
The next wave is northern too. East Riding of Yorkshire, Sheffield and Sefton are among the councils approving the most new schemes, and as our August Court Report found, many of the biggest are conversions of empty industrial units.
The South hasn't stalled; it has spread outwards. The most saturated councils sit in London's commuter belt, like Hertsmere, Welwyn Hatfield and Mid Sussex, while London itself is the most underserved English region.
Northern Ireland punches well above its weight. It has 124 courts for about 1.9 million people, or 6.5 per 100,000. That puts it level with the North West as the best-served part of the UK, and three times Scotland. Much of that is one operator: Let's Go Padel runs 13 of its 26 clubs.
By council, the gap is even wider. The most saturated councils have three to six times the GB average.
The most saturated councils
Courts per 100,000 people, councils with more than 100,000 residents. Source: Padel Genie live count · Census 2021 populations.
And at the other end. 38 councils with more than 100,000 residents have no open padel court inside their boundary. That is the natural place to start looking for your next site, and it is exactly what Padel Genie is built for.
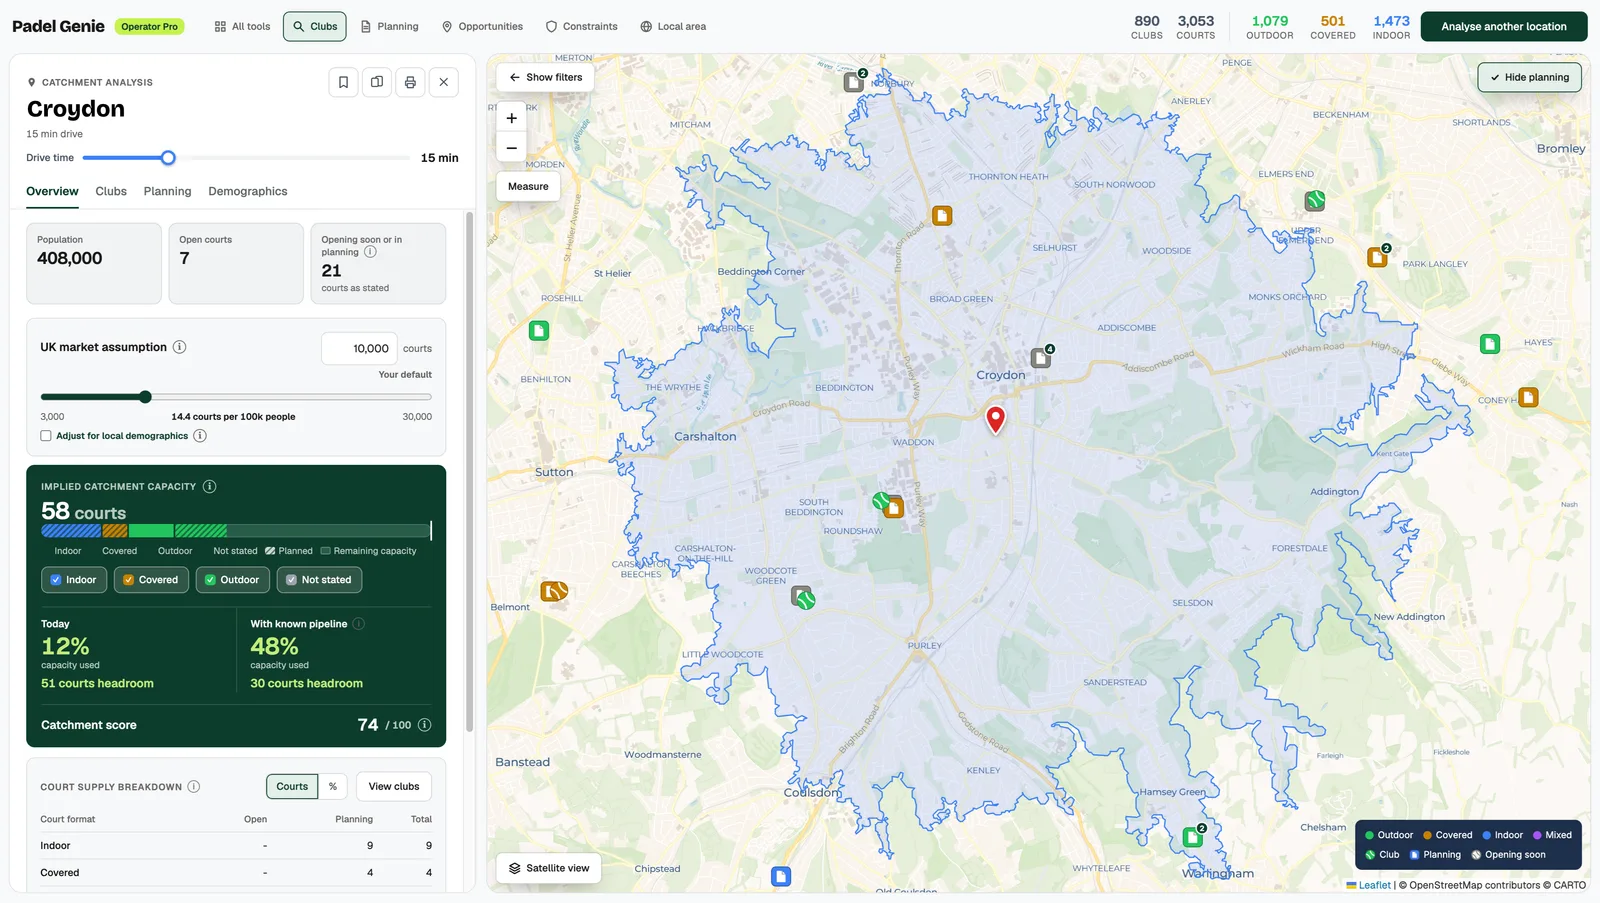
Understanding saturation. Everyone in padel has a number in their head for where the UK tops out. Spread evenly across the population, 5,000 courts would be about 7.5 per 100,000 people, and 10,000 would be about 15. Today it's 4.6. Whatever your number, the job is the same: find the catchments still below it. In Padel Genie you set your own saturation level with a slider, and it shows you every catchment that still has room.
Want to know which 38, and where your number still leaves room? Book a call and we'll show you the councils with no courts, the catchments with the most headroom, and how to secure the best sites in them.
Who is building UK padel
No single operator dominates. The largest network holds about 6% of UK courts, and every other operator holds under 3%.
| Operator | Clubs | Courts | Courts per club |
|---|---|---|---|
| David Lloyd | 59 | 187 | 3.2 |
| Let's Go Padel | 13 | 77 | 5.9 |
| Game4Padel | 28 | 71 | 2.5 |
| Powerleague | 13 | 55 | 4.2 |
| PadelStars | 15 | 53 | 3.5 |
| Pure Padel | 10 | 52 | 5.2 |
| PadelHub | 9 | 51 | 5.7 |
| Slazenger | 4 | 42 | 10.5 |
Courts by operator
No single model is winning yet. Groups like David Lloyd and Powerleague are adding a few courts to sites they already run, a smart, low-risk way in. Dedicated operators like Let's Go Padel, PadelHub and Pure Padel are building bigger clubs from scratch, averaging five to six courts each. Others pair padel with gyms, studios or food and drink, and the mix varies by region. We'll dig into what's working where in a future post, so sign up to the newsletter if you haven't already.
Bubble or not?
If you've read it this far, you're deeply invested in padel and probably also saw Bloomberg's article questioning if the 'bubble was about to burst'. In our opinion, that's nonsense. Not only was their data out of date, but there is no national bubble, only local ones.
The question is never "is UK padel saturated?" It is "is this catchment saturated?"
Peak demand is strong. Across 593 clubs we track occupancy and court revenue for, courts were 70% booked at peak times and 31% off-peak between 24th September and 23rd October 2026.
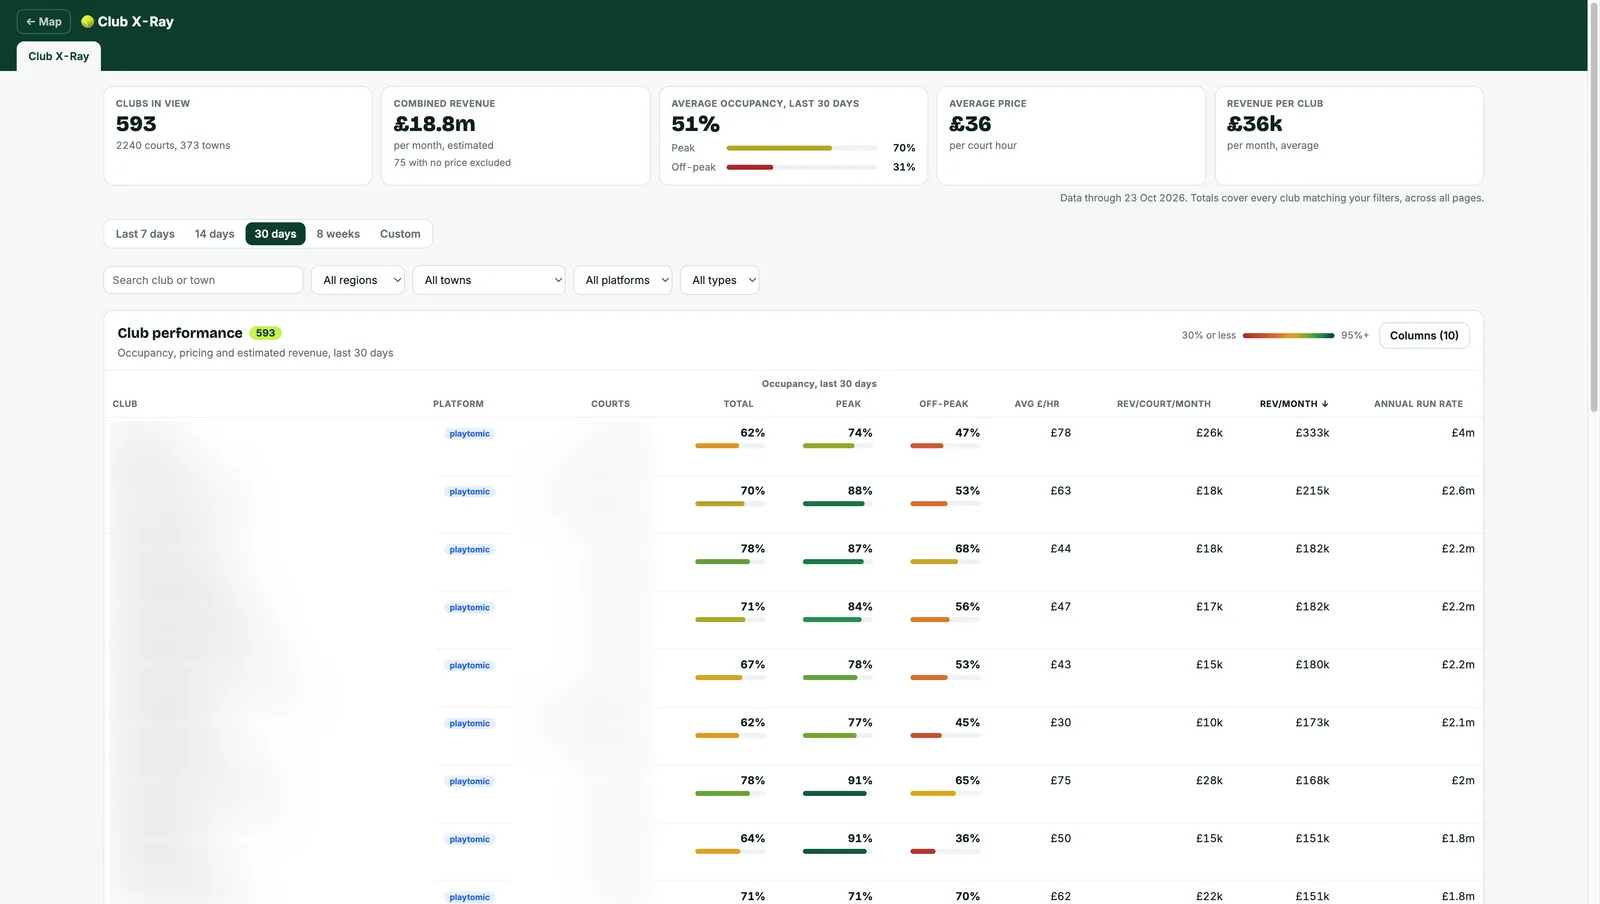
That gap is the real story. As everyone knows, evenings and weekends are busy almost everywhere. Daytime weekday slots are where clubs make or lose their margins, and that depends on the people living around the club: who they are, when they're free and how far they'll travel.
A word of warning. Occupancy data is fascinating, but it only tells you how the past went. It says nothing about where a catchment will be in 12 or 24 months, once the pipeline opens. As they say in investing, past performance is no guide to the future.
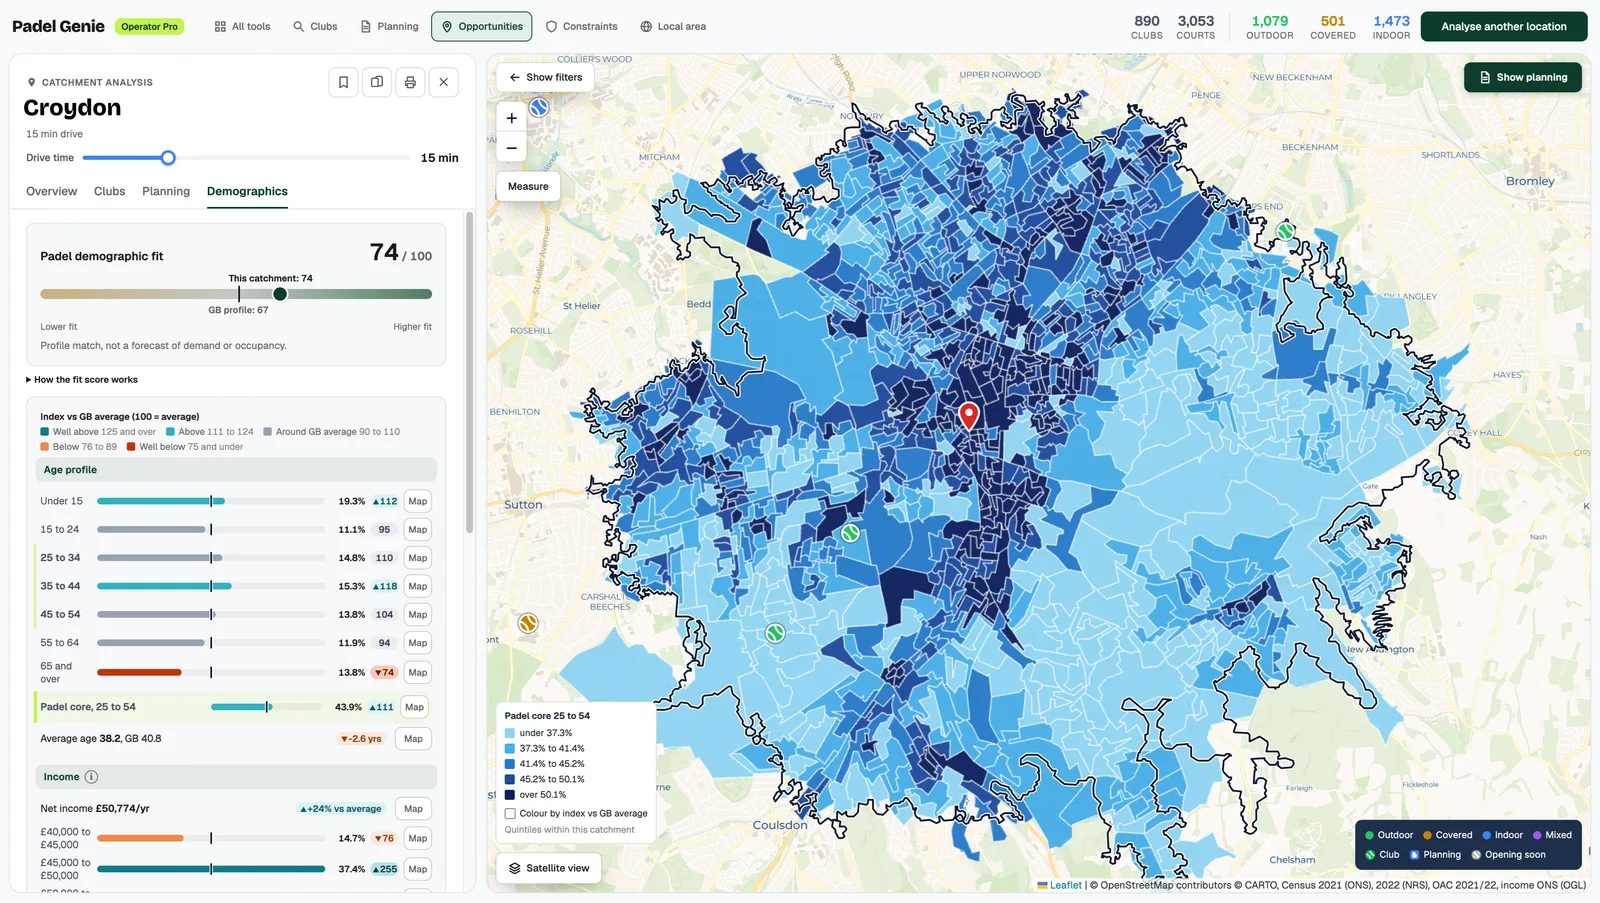
Demographics is destiny. Two catchments a few miles apart can be completely different markets. In one, the daytime courts fill with sessions and coaching for the over-65s. In the next, younger players pack out the evenings, and tournaments and food and drink do the heavy lifting. Household income shapes the rest: whether premium pricing holds, and whether a Pilates studio or a café earns its space.
The best sites are chosen with all of that in mind. Padel Genie's demographics show you who lives in any catchment, and exactly where your target market lives within it.
Location decides the outcome. If you're entering an already highly saturated market, it's always going to be an uphill battle. No amount of marketing can fix a bad location decision and pricing will always come under pressure. But for operators finding great sites on good leases, the market is roaring, and talk of a bubble misses the point.
What it means for you
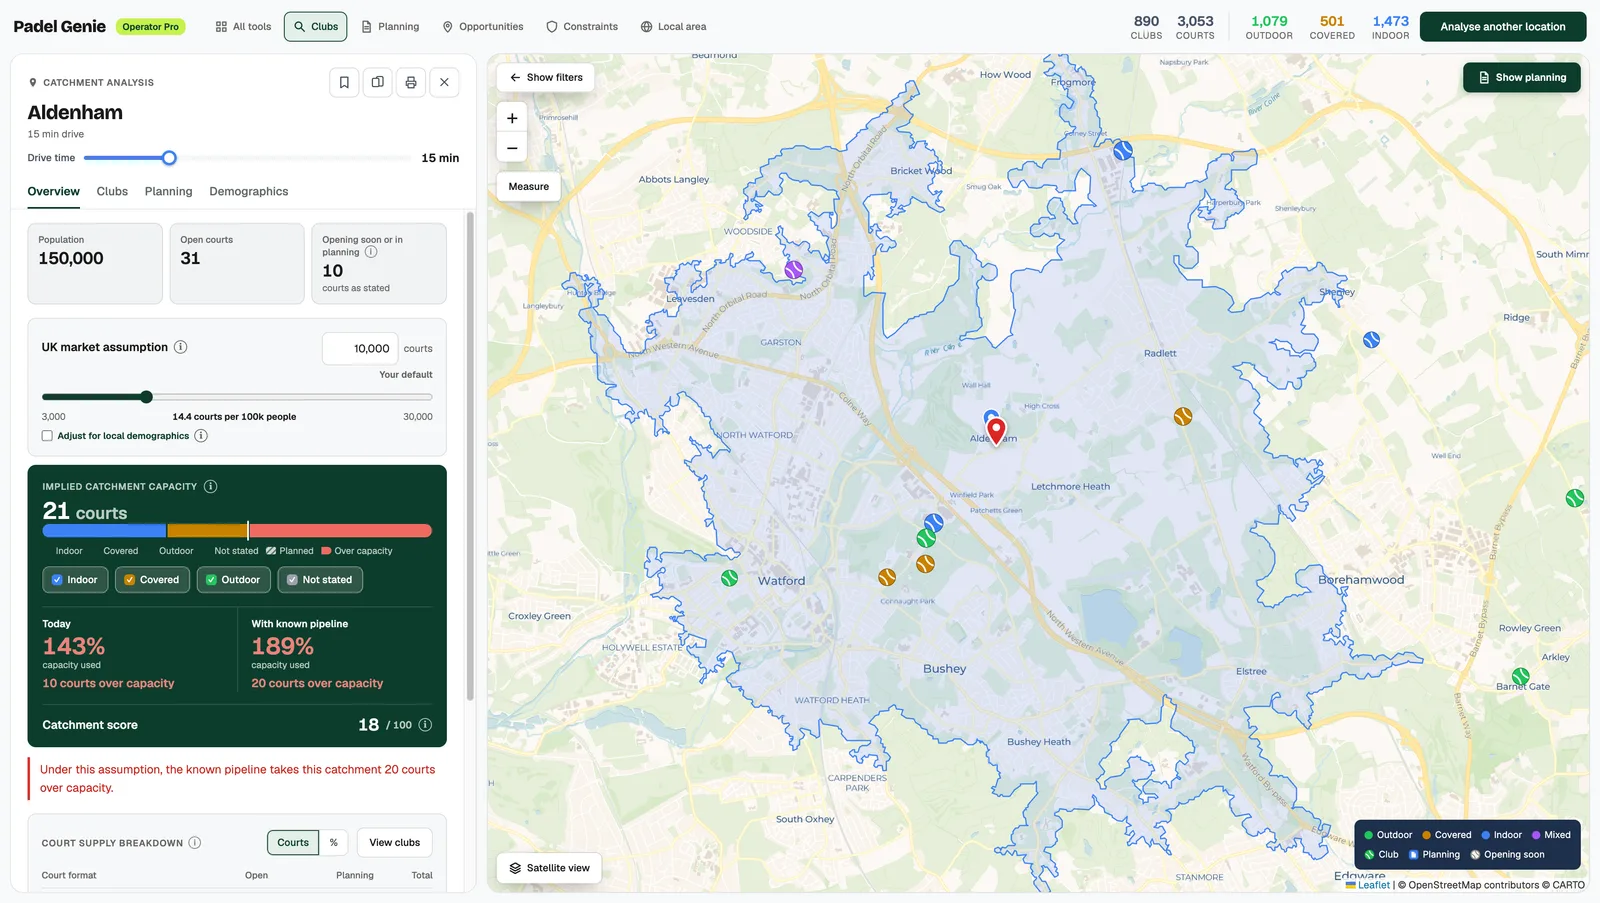
Operators. Planning approval is likely; the site decision is the risk. Before committing to a lease, look at the courts already open within a realistic drive, everything approved or pending in the same catchment, and the population behind it. Then run numbers at different saturation points, model the headroom and assess the demographics. A town with no open club can still be a bad bet if three approved schemes sit ten minutes away and the catchment is too small.
Investors and landlords. Ask any operator pitching a site for its catchment numbers, including the pipeline, not just today's competition. The 1,087 courts awaiting a decision today will change a lot of catchments over the next 18 months. Padel Genie puts that whole pipeline on the map, catchment by catchment, so you can see tomorrow's market today.
Suppliers and builders. Your next customers are in the planning system right now. 572 schemes were approved in the last year and 450 more are waiting. Every one of them needs courts, canopies, lighting, tech, financing and security. The applicant on each one is a lead long before the club opens.
Explore your own area
If you've read this far, we hope it's been insightful. And if you're looking to open a new club, Padel Genie can help.
Padel Genie maps every court and planning application across the UK, layered with demographic data, so you can spot gaps, test saturation and find the best catchments.
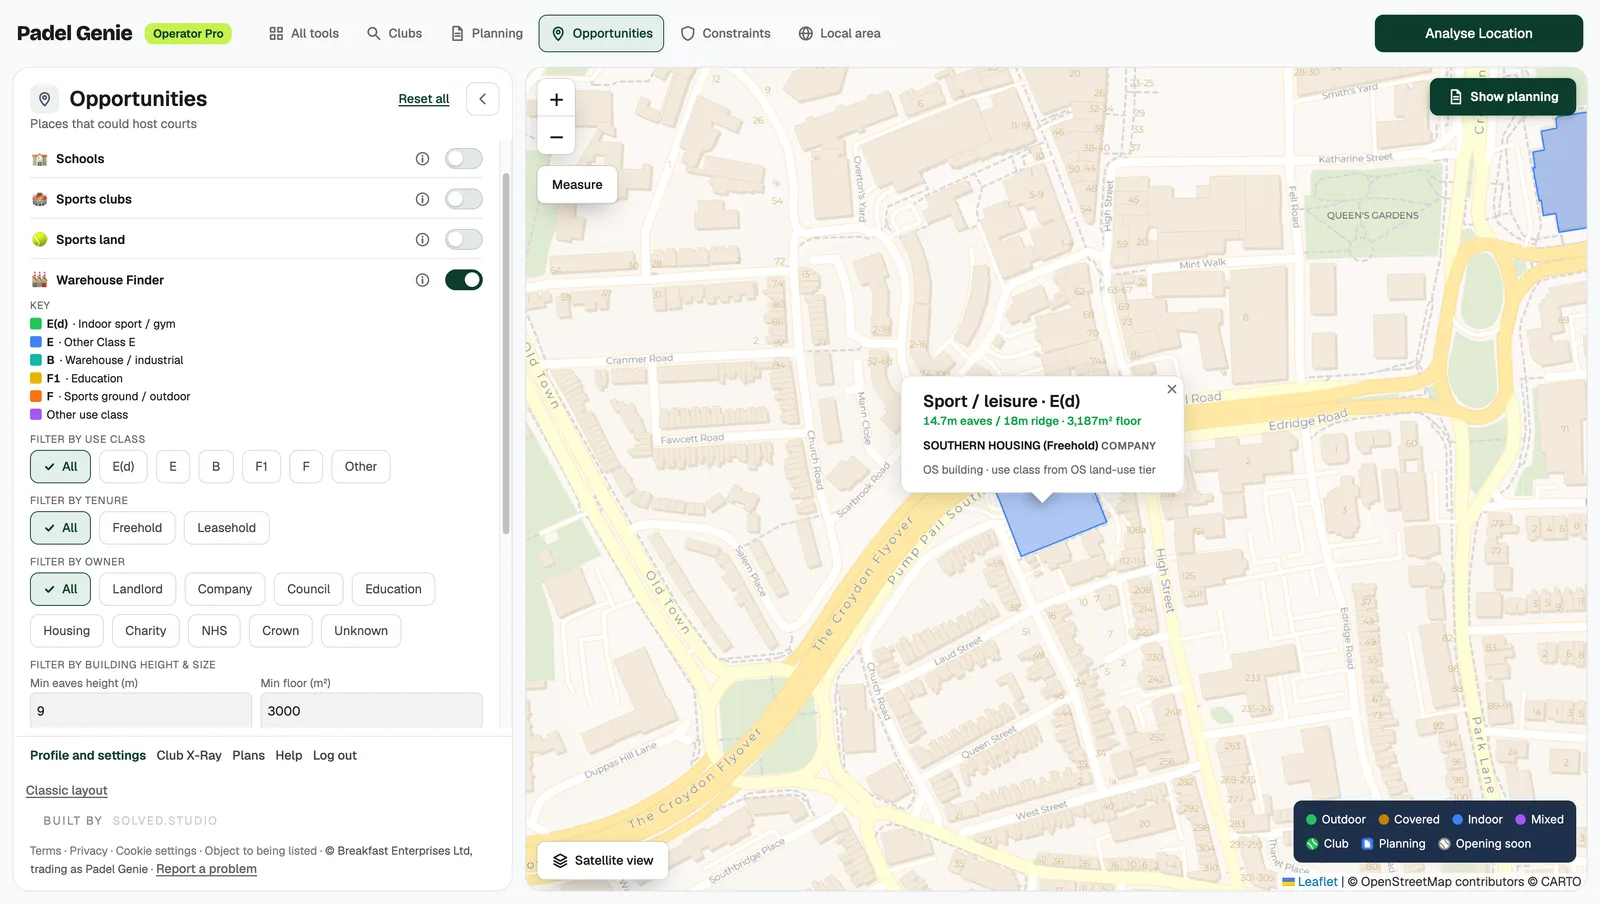
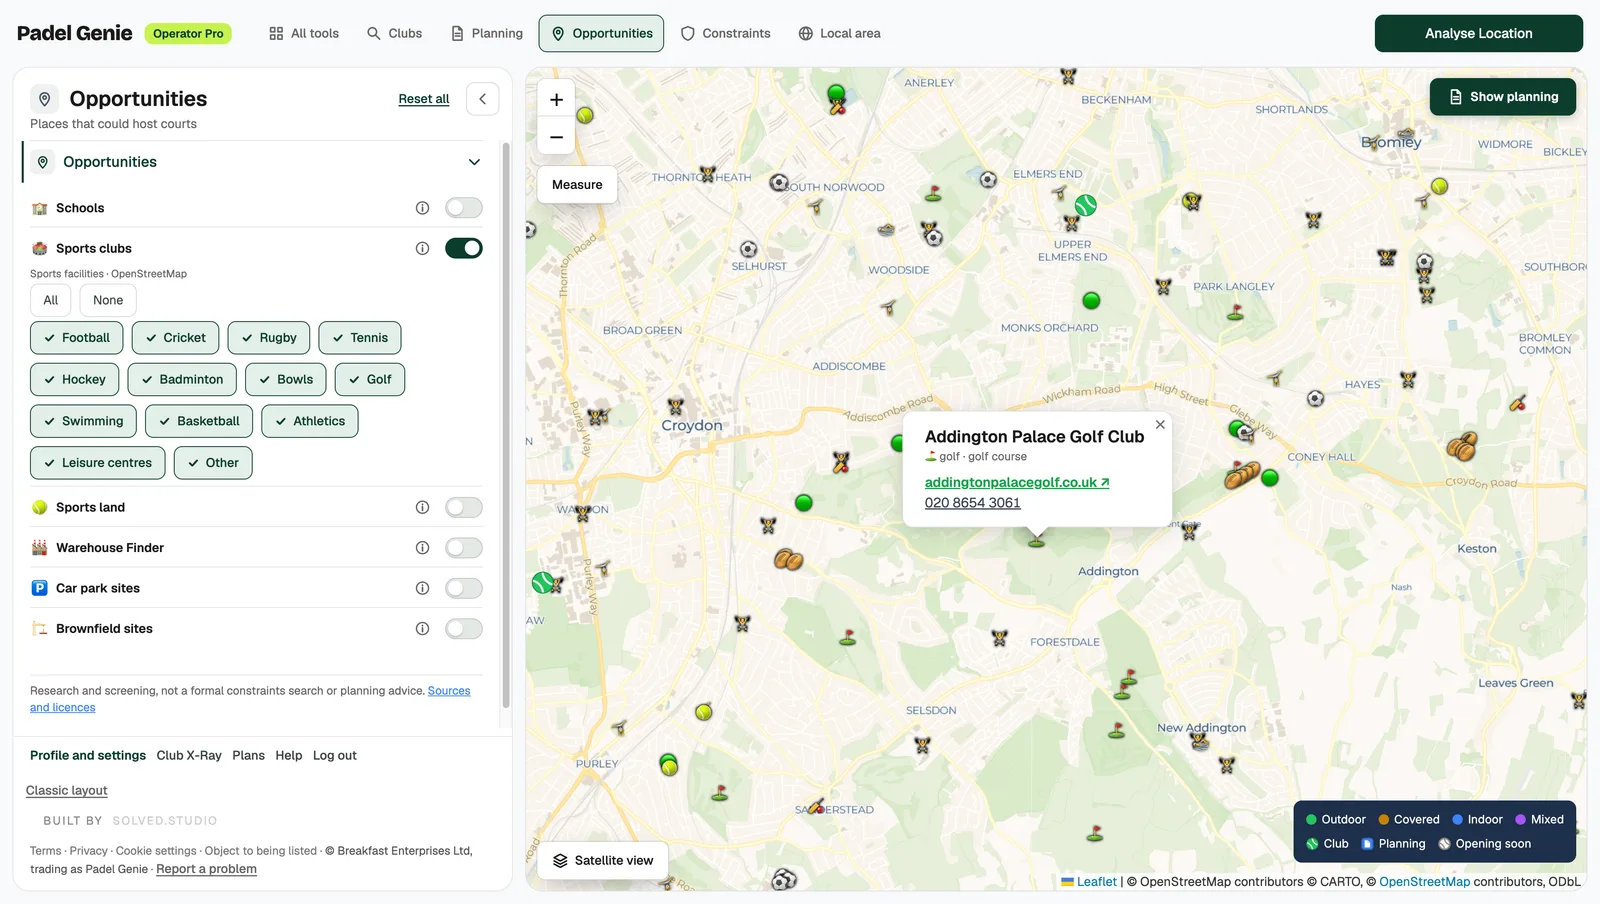
You can even source the site itself. Filter any catchment for warehouses, sports clubs, schools, car parks and brownfield land.
The live map is free to explore at map.padelgenie.io: every open court, plus a free preview of the planning pipeline and catchment analysis. Full access to catchment analysis, site finding and planning details is on our paid plans, which start from just £200 a month, or £160 when paid annually. Or book a call and we'll show you around.
If you haven't looked for a while, now is a good time. Padel Genie has just had a major redesign, so it's faster and cleaner, and the catchment, planning and site tools are easier to get around.
Not on our mailing list yet? Sign up below for new insights behind the real numbers of what's happening in padel.
Be the first to know
Which clubs are opening, which regions are heating up, and where the market is shifting. One email, packed with insight, read in five minutes.
Free. No noise. Unsubscribe any time.
How we count
- Courts open are courts physically at a club that is taking bookings, including singles courts and members-only clubs. The count covers England, Scotland, Wales and Northern Ireland, and moves daily as clubs open.
- Planning figures count new schemes only, leaving out condition discharges, variations and other paperwork on schemes already approved.
- Courts in planning are a floor. Where an application says "courts" without a number we can determine (for example a warehouse change of use), we count two, the minimum. This means the true number is higher.
- Council figures count courts inside each council's boundary, so a club named after a town can sit just outside it.
- Occupancy comes from the booking systems of 593 clubs, as a simple average across clubs. Blocked-out courts count as booked.
- Population figures are from the 2021 Census (ONS and NISRA).
All figures are as of 24 October 2026 unless stated.
Enjoy this blog?
Glad it helped. Want next month's the morning it publishes?
What would make the next one better? We are always trying to improve.